USDA soil map units with hydrologic soil group, as a finished exhibit. One window: SSURGO map units clipped to it, solid-hatched by hydrologic group, labeled, tabulated with an HSG breakdown and total, and exported to CSV, the numbers a stormwater curve-number calc starts from. Runs in plain AutoCAD as well as Civil 3D.
What it does
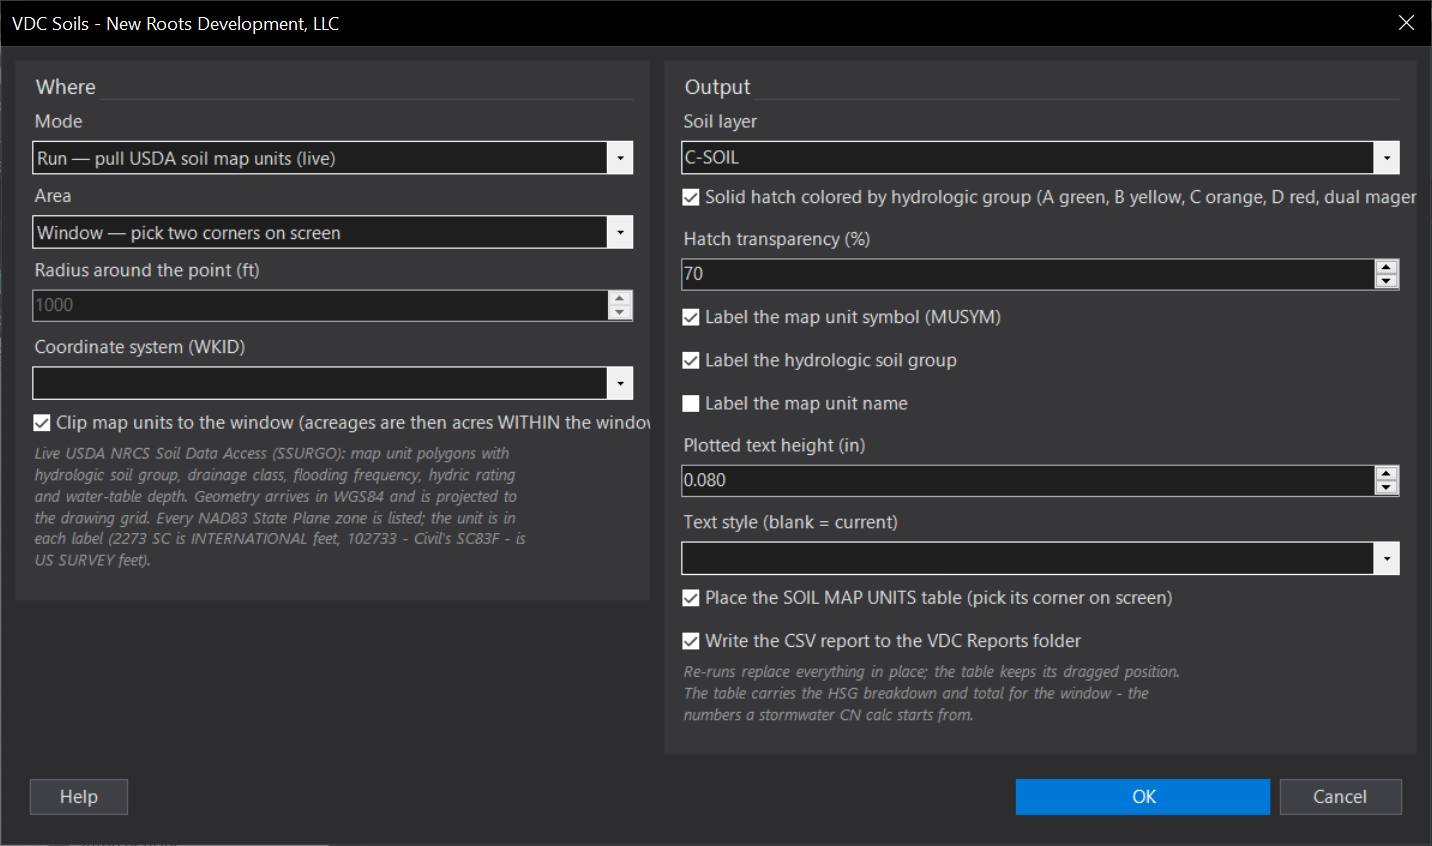
- One query, one exhibit: every SSURGO map unit intersecting the window from the live USDA Soil Data Access service, projected to the drawing grid, clipped to the window (toggle), drawn as closed polylines with islands, a solid hatch colored by hydrologic soil group (transparency editable), and a label at a guaranteed-interior point (MUSYM, HSG, name, each toggleable).
- SOIL MAP UNITS table: one row per unit (symbol, name, HSG, drainage class, flooding frequency, hydric %, annual minimum water-table depth in feet, acres), then a subtotal per hydrologic group with its percentage and the total within the window. Title row carries the notice; the table keeps its dragged position across re-runs.
- CSV in the drawing's
VDC Reportsfolder: every polygon with MUKEY and the aggregate attributes, plus the HSG breakdown. - Replace-in-place / Clear: everything stamped
VDC_SOILS.
Modes, seats & caveats
- Run / Clear; area Window (default) / Point + radius / Extents; any NAD83 State Plane zone.
- Plain AutoCAD: pure AutoCAD entities, ships in
VDC.Acad.bundle. - Planning-level: SSURGO is compiled at soil-survey scale; groups are the map unit's dominant condition, not a site test. Not a geotechnical investigation, every output path says so. Water shows as its own unit.
- The USDA service is slower than an ArcGIS layer (120 s timeout, one automatic retry). Network required. Settings at
%APPDATA%\VDC\Soils\settings.json(envVDC_SOILS_SETTINGS).
Dialog
VDCSOILSWhen to use it
- Stormwater design: the HSG breakdown a curve-number calculation starts from, with the acreages already clipped to the site.
- Due diligence: hydric percentages, water table and flooding frequency across a parcel before the geotech is ordered.
- Exhibits: a colored, labeled soils sheet with a summary table in minutes.
How to run it
- Run VDCSOILS - set the area, WKID, clip / hatch / label options, table and CSV; click OK.
- Pick the window (or the point). The tool queries USDA, projects and clips, prints the funnel (units returned / polygons drawn / outside the window), and draws.
- Pick the table's corner when prompted (Enter skips it). Read the summary: acres within the window and the HSG breakdown.
- Re-run any time to replace; Mode Clear removes linework, hatch, labels and the table.
Options
- Area: Window (default), Point + radius, or Drawing extents.
- Clip to the window: on by default - acreages become acres within the window; off draws the whole map unit polygons.
- Hatch: solid, colored by hydrologic group, transparency editable (default 70%).
- Labels: MUSYM, HSG and map unit name, each toggleable; plotted text height and style.
- Table / CSV: the SOIL MAP UNITS table with subtotals and total; the CSV with every polygon and the HSG breakdown.
Watch out for
- Planning-level mapping, dominant-condition groups - never a geotech report. Verify before design.
- Water bodies come back as their own map unit (W) and can be enormous when not clipped.
- USDA's service is slow and occasionally resets connections; the tool retries once and then reports the outage.
- Network required.
Related: Site Data · Site Snapshot · Terrain · Flood QC